An analysis collects information from Sage HRMS databases and enables you analyze the information in various ways. Using analyses is like creating reports; you can organize information at different levels and vary the amount of information depending on the analysis you select. At the highest level, an analysis can show records that summarize information. At the most detailed level, an analysis can show the specific records that the system used to create the summarized records. When you use analyses, you can quickly view information at the level of specificity you choose.
Getting Around in an Analysis
When you open an analysis, you see the analysis page with which you will be working.
The analysis page consists of several sections:
- The From and Through fields enable you specify the date range that includes the information you want to analyze. If you change one of the dates, click the Refresh button to gather the new information for the new date range.
- The drop-down list at the top of the page enables you select other Sage HRMS analyses.
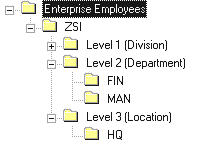
- The selection tree enables you to specify which level or category of information you want to analyze. Use the selection tree to change the information displayed in the data list box.
- The display field below the drop-down list shows you what is currently selected in the selection tree.
- The data list box displays the detailed analysis information in rows and columns. The information changes each time you select another item in the selection tree.
Using the Selection Tree
The selection tree lets you navigate through your enterprise and employers so you can choose the level of specificity for the analysis you select.

When you open the analysis for the first time, the highest branch of your tree (Enterprise Employees in the figure above) is automatically selected and the data list box displays the information related to that branch.
Each time you see a plus sign, you can click it to expand the tree and display the branches below. Click the minus sign to collapse the tree and hide the branches.
When you want to display information for one of the branches on your tree, select the branch by clicking the text (do not click the plus or minus sign) to highlight it. The data list box displays the analysis information for your highlighted selection. You can use your mouse or the ↑ or ↓ keys to select branches in the tree. Each time you make another selection, the information changes in the data list box.
Using the Buttons
The button expands the data list box to the full width of the analysis page. The system temporarily hides the selection tree so you can see more columns in the list box. The display field at the top of the page reminds you which level you are working with.
When you expand your data list box, the button changes to Less Columns. Click Less Columns to return to the normal view and your selection tree.
-
The Show Details check box changes the type and amount of information in the data list box. The usual setting for the data list box is cleared; the system shows analysis information in a condensed form. That is, the system processes information in such a way to show you the "big picture." If you choose to show details, you see all the records that the system used to calculate the information.
For example, if you choose the Turnover analysis, the system shows the total of all terminated employees. To see the individual records that the system used to calculate the total, you can show details. The data list box lists each employee along with their salary.
- Click the Preview button to preview a report containing the information displayed in the data list box.
- Click the Print button to print a report containing the information displayed in the data list box.
- The Refresh button enables you to refresh your data after you change the analysis date range. For example, let’s say you are working with the Turnover analysis with your date range set at 01/01/19 through 12/31/20. Now you want to analyze information from 01/01/20 through 12/31/20. Change your From date to 01/01/20 and click Refresh so Sage HRMS can gather the correct information.
Using Related Reports
Sage HRMS also provides standard reports that contain information similar to that which you can view in each analysis.
